A yoghurt pot goes in the green bin with a triangle stamped on its base, and the assumption is that the triangle means something. Working out what happens to recycling means separating three things that get treated as one: what is collected, what is sorted, and what anybody is willing to buy.
The short version is that recycling works well for paper, cardboard and metal, works for two specific kinds of plastic bottle, and barely functions at all for everything else made of plastic.
The headline national rate hides that split almost completely, because it averages materials that behave nothing like each other.
The headline rate is not about plastic
The figure usually quoted for the United States comes from the Environmental Protection Agency’s national waste accounting, and it is a combined number.
In 2018, the most recent year in the agency’s published series, total municipal solid waste generation was 292.4 million tons, or 4.9 pounds per person per day. Around 69 million tons were recycled and a further 25 million tons composted.
Together that is roughly 94 million tons, which the agency reports as a 32.1 percent recycling and composting rate. Note the second word: a quarter of that total is garden waste and food scraps, composted rather than recycled in any sense a bin symbol would suggest.
The rest is dominated by heavy, valuable, easily sorted material. Paper and paperboard alone made up 23.1 percent of everything generated, and paper, cardboard and metals are where the tonnage actually gets recovered.
Plastic is the outlier, and it is not close
Plastics generation in the same year was 35.7 million tons, about 12.2 percent of all municipal waste. Of that, three million tons were recycled, which the agency puts at a plastics recycling rate of 8.7 percent.
So plastic makes up roughly an eighth of the waste stream and a small fraction of what is recovered from it. The gap between the 32.1 percent everyone quotes and the 8.7 percent applying to the material people most associate with recycling is the single most important number in the subject.
The destination figures make the point plainly. Landfills received 27 million tons of plastic that year, 18.5 percent of everything landfilled, and a further 5.6 million tons were burned for energy recovery.
Two plastics work, the rest mostly do not
Averages are misleading here too, because the 8.7 percent is not spread evenly. PET bottles and jars — drinks bottles, essentially — were recycled at 29.1 percent, and natural HDPE bottles, the translucent kind used for milk and detergent, reached 29.3 percent.
Those two categories carry almost the whole plastics figure between them. Everything else — films, pots, tubs, trays, coloured bottles, multi-layer packaging — sits far below.
The reason is not chemistry so much as commerce. A clear PET bottle is a single, identifiable, uncontaminated polymer available in enormous volume, which makes it a commodity with real buyers and a published price. A yoghurt pot is a small, light, often coloured or laminated item that costs more to collect and sort than the resulting flake is worth to anybody.
The triangle is not a recycling symbol
Here is the misunderstanding that drives most of the rest, and it is worth stating flatly. The chasing-arrows triangle with a number inside is a resin identification code, introduced by the Society of the Plastics Industry in 1988 under the name Voluntary Plastic Container Coding System, to tell sorters which polymer they were handling.
Resin codes do not indicate whether a product is recyclable. The presence of the symbol says no more about recyclability than its absence says about the reverse.
It was designed by the industry, adopted voluntarily, and drawn to resemble the universal recycling symbol. The confusion that followed was not an accident of design so much as a predictable consequence of it.
Regulators noticed. On EPA recommendation, the standards body ASTM replaced the arrows with a solid triangle in 2013, precisely because the original mark was being read as a promise.
The parallel with clothing is exact. A symbol that looks official, invented by the industry it describes, binding nobody — the same structure that explains why clothing sizes are inconsistent.
What a sorting facility physically does
Collected material goes to a materials recovery facility, where it is separated mechanically rather than by hand for the most part.
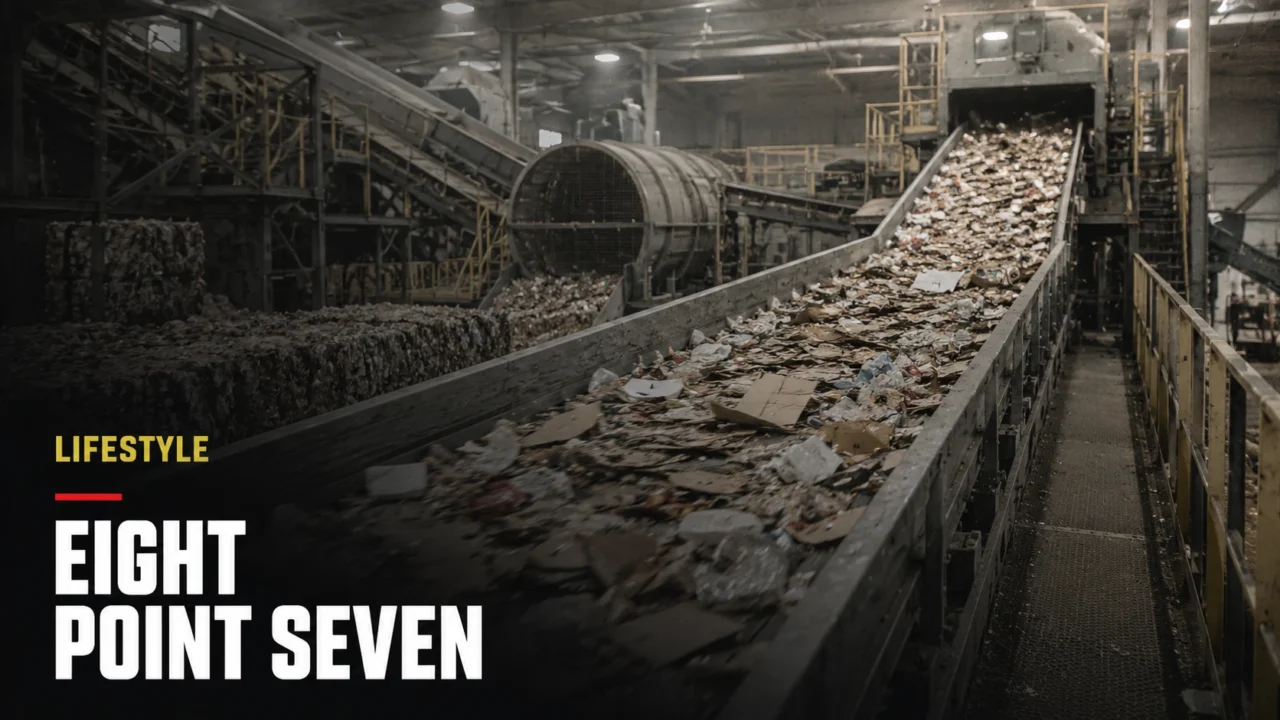
Angled screens bounce flat items like cardboard upward while containers roll down. Magnets lift steel out. An eddy current, which induces a charge in non-magnetic metal, flicks aluminium off the end of the belt. Optical scanners identify plastics by the light they reflect and fire jets of air to knock chosen types into separate bins.
Every one of those steps assumes the material arriving is roughly what the machine expects. The equipment is fast and cheap per ton precisely because it is not intelligent, and that trade is the reason contamination is so costly.
Wishcycling makes the problem worse
Putting a doubtful item in the recycling bin feels like the cautious choice. It is the opposite. The industry term for this is wishcycling, and its cost is contamination — a sorting facility processes a mixed stream at speed, and the wrong material in that stream is not merely ignored.
Some contaminants are mechanical problems. Plastic bags and film wrap around rotating equipment and shut a line down until somebody cuts them out by hand.
Others are economic. A bale of paper with food residue or broken glass through it is worth less, and past a threshold it is worth nothing and gets landfilled entire — including the genuinely recyclable material inside it.
So a hopeful item in the bin can subtract from the total rather than adding to it. This is the rare case where doing less produces more.
Collection design made this worse in a way nobody intended. Most systems moved from separated bins to single-stream collection, where everything goes into one container, because participation rises sharply when sorting is not asked of the household.
More material arrives that way, and it arrives dirtier and more mixed. The gain in volume is partly cancelled by the loss in quality, and the balance between those two is still argued over by the people who run the facilities.
Why 2018 keeps appearing
That year is a hinge, and not only because it is where the published data stops. For decades a large share of collected recyclable material was exported, with China the dominant buyer, and low-value mixed plastics and mixed paper were shipped rather than processed domestically — which made collection economics work even for materials with no local market.
China’s import restrictions closed that outlet, and the material had to be dealt with at home or not at all. Prices for mixed plastic collapsed, and many municipal programmes discovered that what they had been collecting had no buyer.
Some responded by narrowing what they accept, which is why bin rules vary so much between towns and why a list that was accurate five years ago may not be now.
What separates a material that recycles from one that does not
Whether something is recycled in practice depends on four things, and none of them is whether it is technically possible.
- Value: is the recovered material worth more than the cost of collecting and sorting it
- Sortability: can a machine identify it reliably at speed, or does it need a human
- Purity: is it one material, or a laminate of several that cannot be separated
- Volume: is there enough of it, consistently, to supply a buyer
Aluminium passes all four emphatically. It is valuable, magnetically separable from steel, chemically simple, and recycling it uses a small fraction of the energy of making it from ore. Glass passes on purity and fails on value, because it is heavy to transport and cheap to make new.
Most plastic fails on three of the four at once, which is why the outcome has been stable for years despite considerable effort and expenditure.
There is a further asymmetry that the word recycling obscures. Aluminium and glass can be melted and remade indefinitely without losing anything, so a can genuinely becomes another can.
Plastic degrades each time it is reprocessed, and the polymer chains shorten. A recycled bottle usually becomes fibre, sheeting or decking rather than another bottle, which is a one-way step down the ladder rather than a loop — the industry calls it downcycling.
What the numbers actually support
The evidence sustains a narrower claim than either of the usual positions. Recycling is not a fraud: paper, cardboard, aluminium and steel are genuinely recovered at scale, and the tonnage involved is large enough to matter environmentally.
Nor is it working for plastic. An 8.7 percent rate, concentrated almost entirely in two container types, is not a system with a delivery problem — it is a system doing roughly what its economics permit.
One honest caveat about all of these figures. They are national accounting estimates rather than direct measurements, assembled from industry associations and state reporting, and the agency’s own data on contamination in particular is thin.
The headline percentage also has the same weakness as any aggregate. A single national figure covering materials that behave completely differently tells you very little about any of them, in the same way that how inflation is measured produces one number that describes no actual household.
The practical reading is that the bin is not one system but several sharing a lorry. Two of them work well, one of them barely works at all, and the symbol on the packaging was never designed to tell you which is which.
For a related mechanism, see our explainer on how medical devices are approved.